Commodities Lab
Coffee, cocoa and base metals on one desk
Two years of prices, read for trend, risk and relationships in one place, with an assistant that answers only from the data it holds.
- 5Commodities in the demo
- 2 yearsOf daily closes each
- 5Views, from monitor to forecast check
Show the numbers
| Date | Coffee | Cocoa | Aluminium | Zinc | Copper |
|---|---|---|---|---|---|
| 2024-11-13 | 100 | 100 | 100 | 100 | 100 |
| 2024-12-12 | 92 | 99 | 102 | 99 | 100 |
| 2025-01-10 | 107 | 95 | 101 | 101 | 95 |
| 2025-02-10 | 109 | 103 | 103 | 95 | 103 |
| 2025-03-11 | 113 | 102 | 93 | 89 | 96 |
| 2025-04-09 | 91 | 92 | 98 | 96 | 96 |
| 2025-05-08 | 84 | 104 | 96 | 90 | 92 |
| 2025-06-06 | 90 | 111 | 102 | 89 | 95 |
| 2025-07-07 | 97 | 86 | 102 | 88 | 95 |
| 2025-08-05 | 87 | 89 | 100 | 95 | 95 |
| 2025-09-03 | 88 | 83 | 98 | 95 | 95 |
| 2025-10-02 | 91 | 88 | 90 | 87 | 89 |
| 2025-10-31 | 93 | 84 | 86 | 76 | 87 |
| 2025-12-01 | 86 | 82 | 84 | 77 | 87 |
| 2025-12-30 | 78 | 86 | 79 | 81 | 81 |
| 2026-01-28 | 75 | 88 | 76 | 77 | 77 |
| 2026-02-26 | 72 | 93 | 80 | 84 | 81 |
| 2026-03-27 | 59 | 81 | 84 | 90 | 85 |
| 2026-04-27 | 54 | 78 | 77 | 84 | 81 |
| 2026-05-26 | 47 | 80 | 77 | 77 | 84 |
| 2026-06-24 | 44 | 77 | 78 | 81 | 85 |
| 2026-07-23 | 49 | 80 | 78 | 82 | 85 |
| 2026-08-21 | 50 | 80 | 78 | 74 | 82 |
| 2026-09-21 | 47 | 71 | 70 | 72 | 82 |
| 2026-10-20 | 52 | 80 | 66 | 67 | 76 |
| 2026-11-12 | 50 | 74 | 65 | 66 | 76 |
Illustrative chart · simulated data
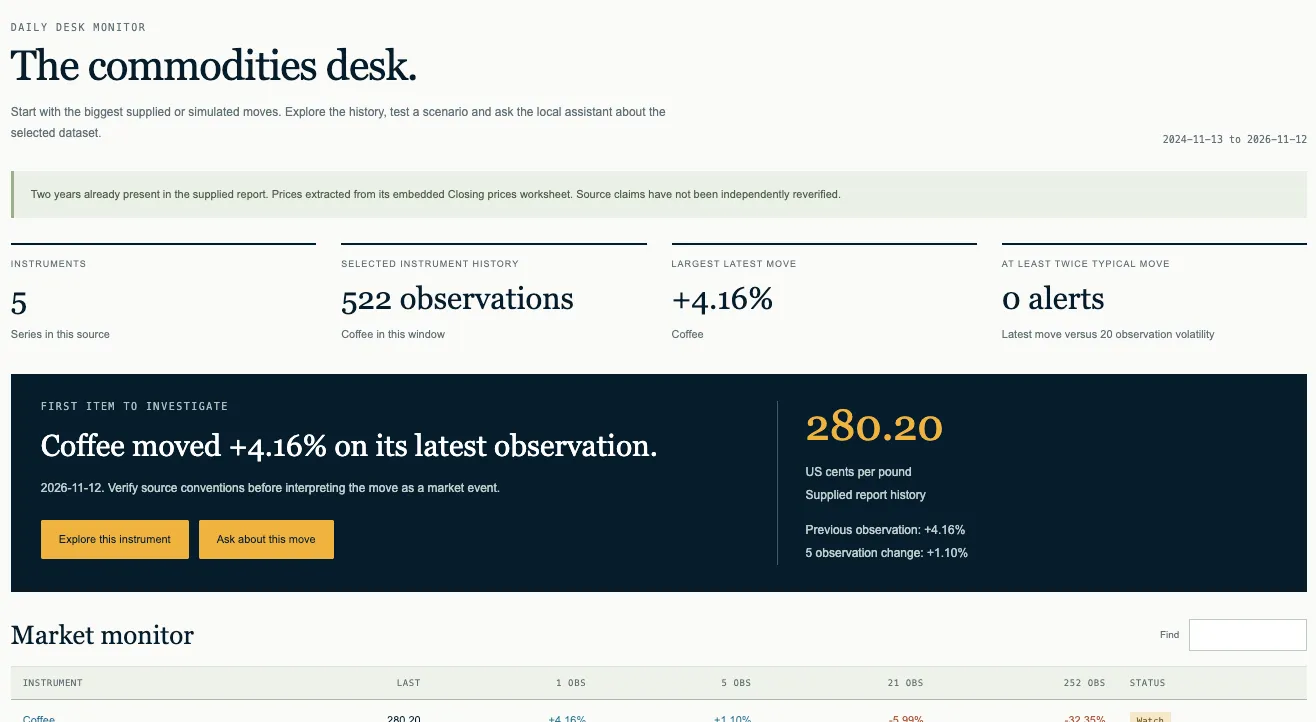
Desk monitor
The biggest moves first, every morning
- Every commodity rebased to the same start, so performance compares at a glance
- Moves at least twice their usual size are flagged as alerts
- One click from a move to its full history
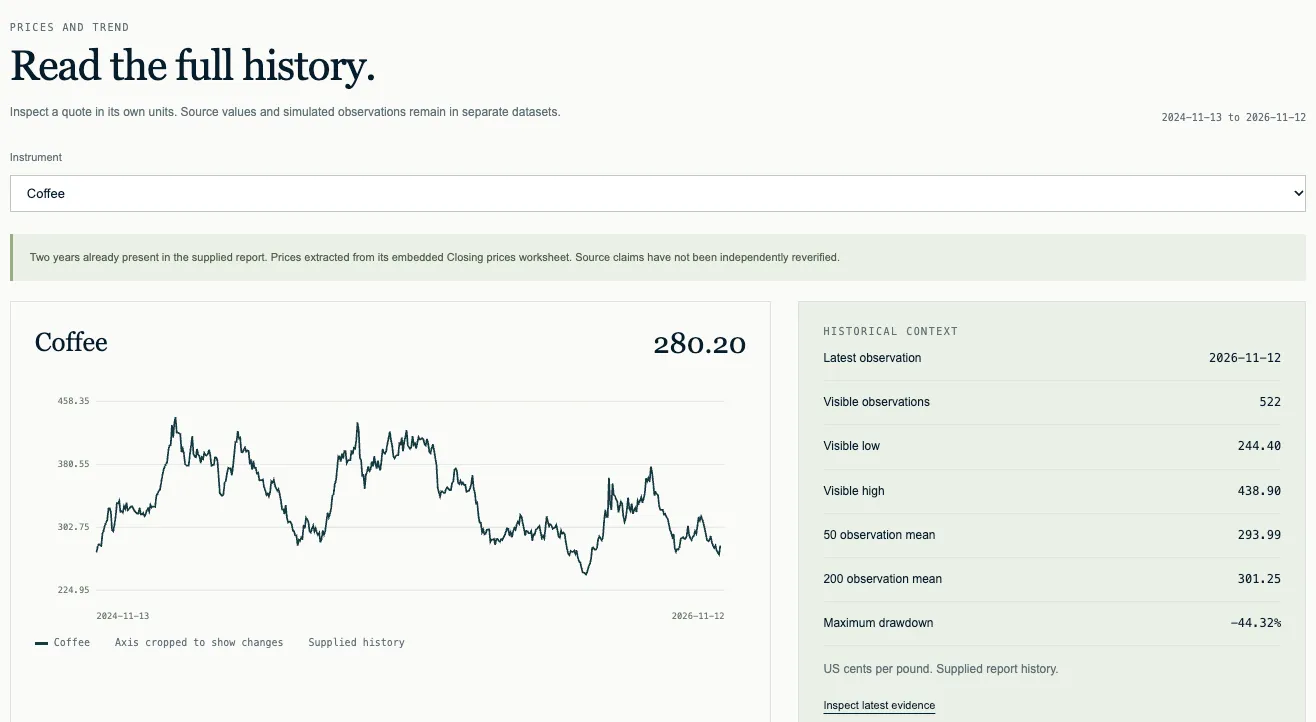
Prices and trend
Read the full history
- 50 and 200 day averages, the year's range and the deepest drawdown
- Each commodity in its own unit, as the market quotes it
- The original report stays one click away, including hedge-fund positioning and LME stocks
Larger than 93% of the 521 days in the sample.
Show the numbers
| Daily move | Days |
|---|---|
| -7.3% to -6.8% | 1 |
| -6.8% to -6.2% | 0 |
| -6.2% to -5.6% | 0 |
| -5.6% to -5.0% | 1 |
| -5.0% to -4.4% | 7 |
| -4.4% to -3.8% | 8 |
| -3.8% to -3.2% | 23 |
| -3.2% to -2.6% | 21 |
| -2.6% to -2.1% | 43 |
| -2.1% to -1.5% | 31 |
| -1.5% to -0.9% | 51 |
| -0.9% to -0.3% | 57 |
| -0.3% to +0.3% | 57 |
| +0.3% to +0.9% | 49 |
| +0.9% to +1.5% | 51 |
| +1.5% to +2.1% | 35 |
| +2.1% to +2.6% | 31 |
| +2.6% to +3.2% | 30 |
| +3.2% to +3.8% | 11 |
| +3.8% to +4.4% | 9 |
| +4.4% to +5.0% | 3 |
| +5.0% to +5.6% | 2 |
| +5.6% to +6.2% | 0 |
| +6.2% to +6.8% | 0 |
| +6.8% to +7.3% | 0 |
Illustrative chart · simulated data
Risk
Is today's move unusual, or just coffee?
- Each day's move set against every day in the sample
- Volatility, a historical loss threshold and maximum drawdown per commodity
- Risk per futures contract, so the softs and the metals compare in money
| Coffee | Cocoa | Aluminium | Zinc | Copper | |
|---|---|---|---|---|---|
| Coffee | 1.00 | 0.03 | -0.05 | -0.06 | -0.07 |
| Cocoa | 0.03 | 1.00 | 0.03 | -0.02 | -0.02 |
| Aluminium | -0.05 | 0.03 | 1.00 | 0.56 | 0.58 |
| Zinc | -0.06 | -0.02 | 0.56 | 1.00 | 0.56 |
| Copper | -0.07 | -0.02 | 0.58 | 0.56 | 1.00 |
Illustrative chart · simulated data
Relationships
Which commodities move together
- Correlation of daily returns across every pair
- Spot which commodities tend to move as a group, and which follow their own drivers
- A pattern, not a cause: the view says so on screen
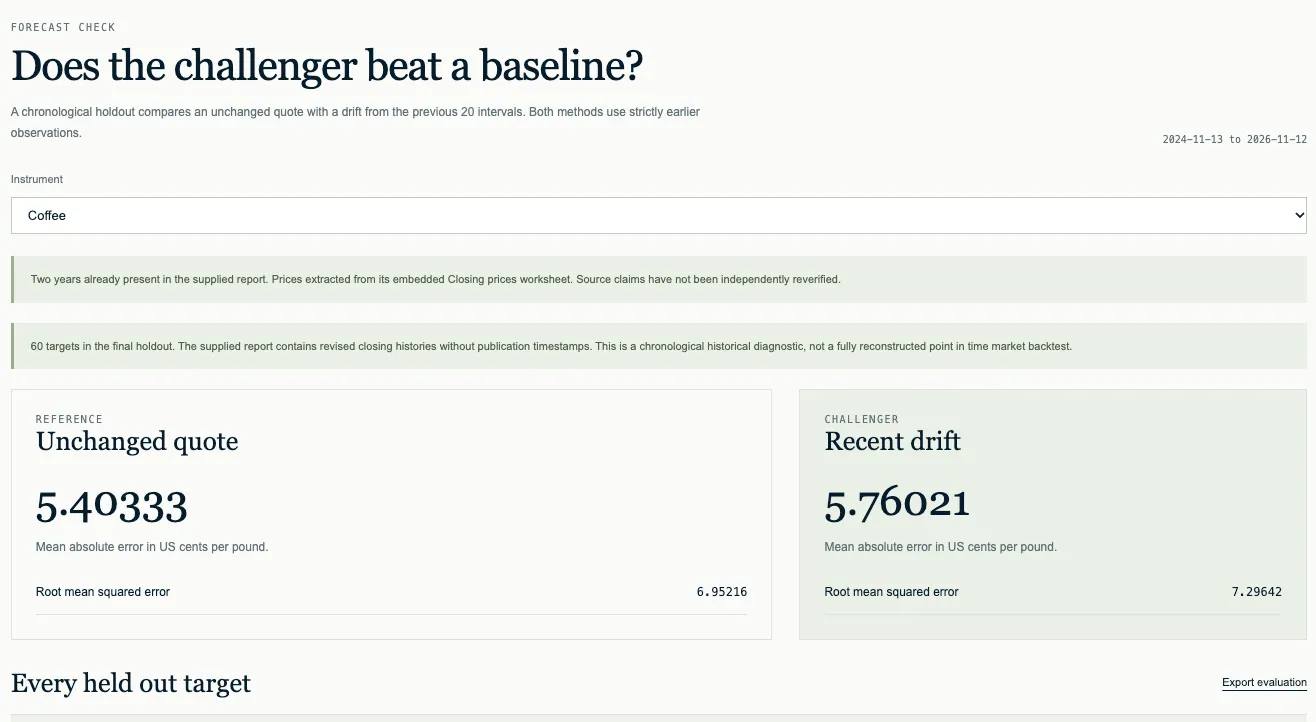
Forecast check
Test a forecast before anyone relies on it
- A challenger forecast against a simple baseline: tomorrow equals today
- Scored on days the model never saw, in date order
- If the challenger does not beat the baseline, the screen shows it
Built to be checked
Every answer shows where it came from
Which instruments moved most?
Coffee: latest move +4.16% on 12 Nov 2026
Source: Closing prices worksheet in the supplied reportCocoa: latest move +3.24% on 12 Nov 2026
Source: Closing prices worksheet in the supplied reportAluminium: latest move -2.11% on 12 Nov 2026
Source: Closing prices worksheet in the supplied report
- Answers from stored data only
A question the data cannot answer is refused, not guessed.
- Sources stay attached
Each number names the file it came from.
- Can run on your own machine
The language model can run locally, so research and positions stay inside.
- 01Ingest
Bloomberg files and supplied market reports, kept in their original form.
- 02Check
Ambiguous rows are excluded and missing values stay missing. Nothing is filled in silently.
- 03Analyse
Trend, risk, scenarios, relationships and a forecast check, on the cleaned history.
- 04Ask
Questions are answered from the stored data, with the source of every number.
- 9Bloomberg files in
- 15,800Rows read
- 30Rows excluded
- 4,225Observations kept
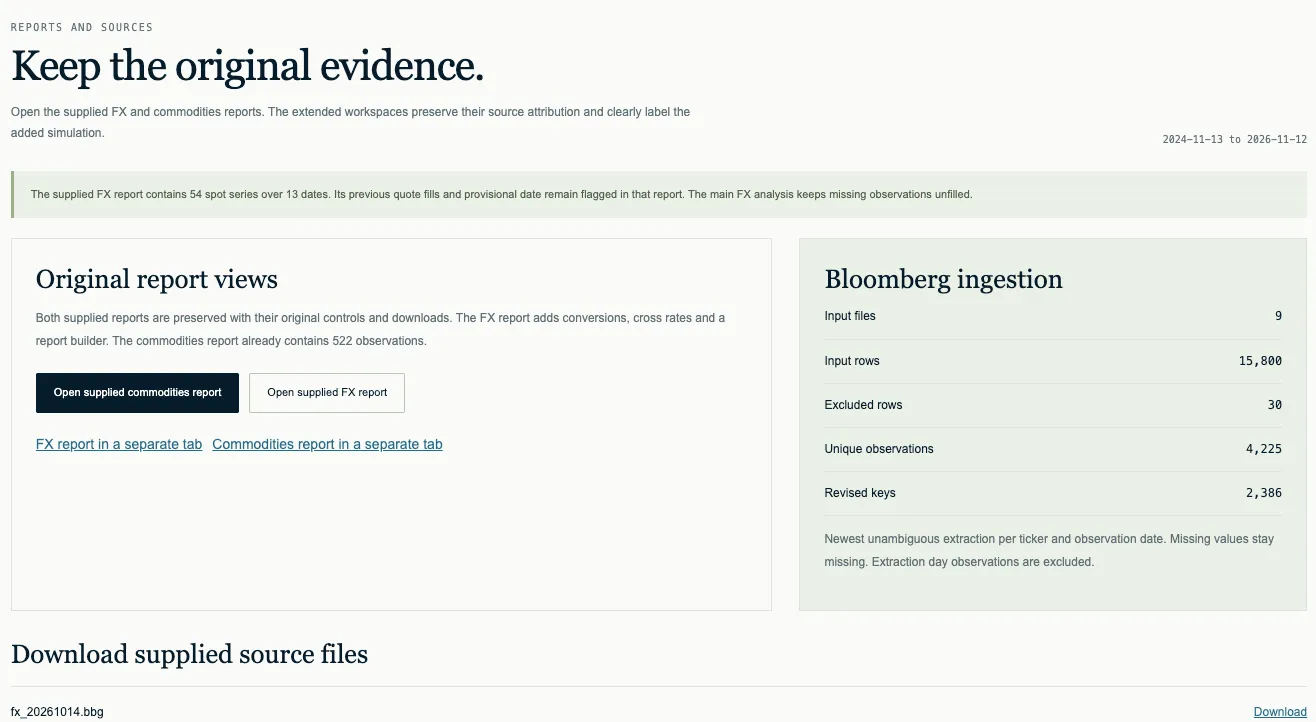
Sources
Bloomberg in, original evidence kept
- Bloomberg files ingested as they are, with every row counted
- Supplied reports preserved with their own controls and downloads
- Simulated data, where used, is labelled and kept apart from source data