FX Lab
Every currency pair, with the moves that matter first
A daily monitor for treasury and FX desks: what moved, how unusual it was, and what it would do to a position, with an assistant that answers only from the data it holds.
- 55Currency pairs in the demo
- 2 yearsOf daily history each
- BloombergFiles ingested, sources kept
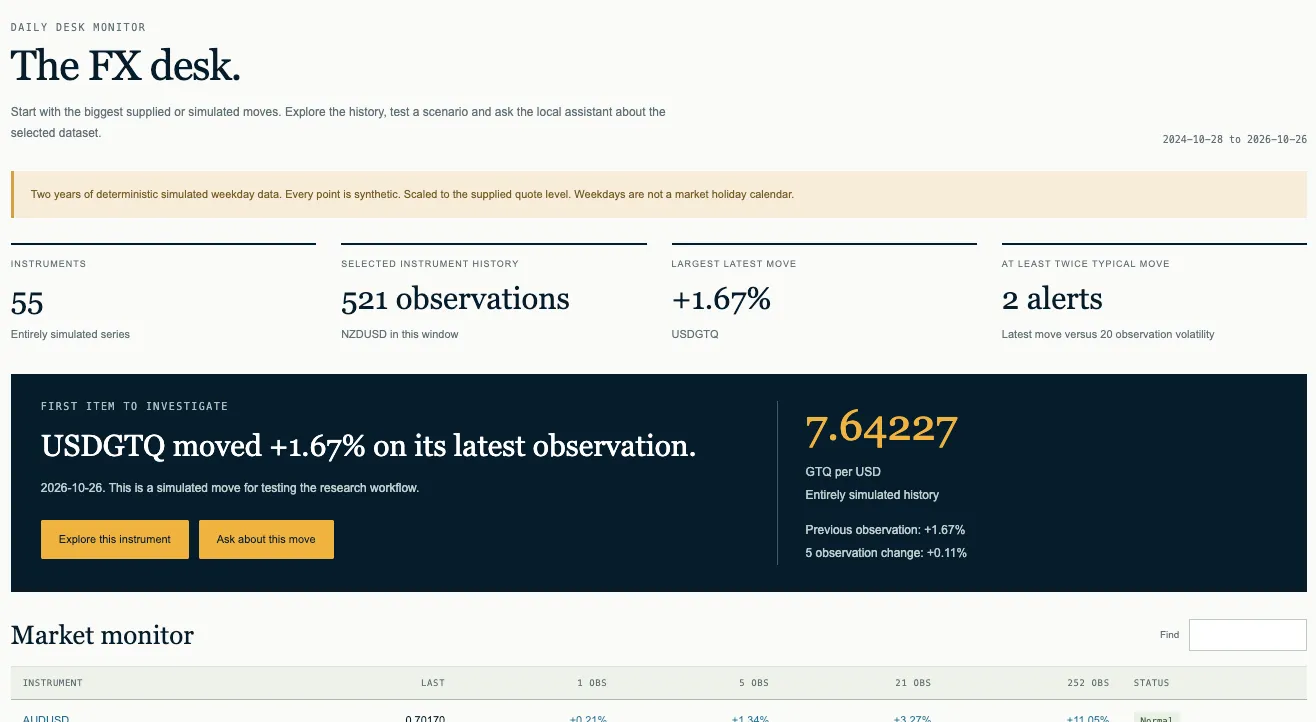
Desk monitor
Start the day with what moved
- Every pair with its 1, 5, 21 and 252 day change, in one searchable table
- Moves at least twice their usual size are flagged as alerts
- The first item to investigate, with a link to its history and a question for the assistant
Show the numbers
| Date | EUR/USD | 50-day average |
|---|---|---|
| 2024-10-28 | 1.0800 | n/a |
| 2024-11-26 | 1.1050 | n/a |
| 2024-12-25 | 1.1284 | n/a |
| 2025-01-23 | 1.1709 | 1.1366 |
| 2025-02-21 | 1.1875 | 1.1622 |
| 2025-03-24 | 1.1746 | 1.1764 |
| 2025-04-22 | 1.1870 | 1.1781 |
| 2025-05-21 | 1.2587 | 1.1928 |
| 2025-06-19 | 1.2852 | 1.2389 |
| 2025-07-18 | 1.2813 | 1.2715 |
| 2025-08-18 | 1.2354 | 1.2664 |
| 2025-09-16 | 1.2281 | 1.2522 |
| 2025-10-15 | 1.2258 | 1.2341 |
| 2025-11-13 | 1.2398 | 1.2319 |
| 2025-12-12 | 1.2284 | 1.2267 |
| 2026-01-12 | 1.2317 | 1.2251 |
| 2026-02-10 | 1.2656 | 1.2371 |
| 2026-03-11 | 1.2439 | 1.2571 |
| 2026-04-09 | 1.2517 | 1.2640 |
| 2026-05-08 | 1.2147 | 1.2464 |
| 2026-06-08 | 1.2739 | 1.2427 |
| 2026-07-07 | 1.2958 | 1.2650 |
| 2026-08-05 | 1.2806 | 1.2870 |
| 2026-09-03 | 1.2368 | 1.2768 |
| 2026-10-02 | 1.2683 | 1.2588 |
| 2026-10-26 | 1.3078 | 1.2644 |
Illustrative chart · simulated data
Prices and trend
Read a pair in its own units
- Full history with 50 and 200 day averages, range and maximum drawdown
- Source values and simulated observations kept in separate datasets
- A forecast check scores any challenger against an unchanged quote
- -10%-€10,000
- -5%-€5,000
- -2%-€2,000
- +2%+€2,000
- +5%+€5,000
- +10%+€10,000
Illustrative · same calculation as the demo
Risk and scenarios
What a move would do to a position
- Volatility, a 95% historical loss threshold and maximum drawdown per pair
- Stress any position value by a chosen move, in your reporting currency
- Plain about its limits: no fees, spreads, hedges or probabilities included
| EUR/USD | GBP/USD | AUD/USD | USD/JPY | USD/CHF | USD/CAD | |
|---|---|---|---|---|---|---|
| EUR/USD | 1.00 | 0.40 | 0.36 | -0.24 | -0.36 | -0.23 |
| GBP/USD | 0.40 | 1.00 | 0.34 | -0.26 | -0.38 | -0.17 |
| AUD/USD | 0.36 | 0.34 | 1.00 | -0.23 | -0.35 | -0.19 |
| USD/JPY | -0.24 | -0.26 | -0.23 | 1.00 | 0.28 | 0.25 |
| USD/CHF | -0.36 | -0.38 | -0.35 | 0.28 | 1.00 | 0.21 |
| USD/CAD | -0.23 | -0.17 | -0.19 | 0.25 | 0.21 | 1.00 |
Illustrative chart · simulated data
Relationships
See which pairs move together
- Correlation of daily returns on shared dates
- Change the history window to see a relationship hold or break
- A pattern, not a cause: the view says so on screen
Built to be checked
Every answer shows where it came from
Which instruments moved most?
USD/GTQ: latest move +1.67% on 26 Oct 2026
Source: Simulated series, seeded so it can be reproducedUSD/TWD: latest move +1.66% on 26 Oct 2026
Source: Simulated series, seeded so it can be reproducedUSD/SGD: latest move -1.32% on 26 Oct 2026
Source: Simulated series, seeded so it can be reproduced
- Answers from stored data only
A question the data cannot answer is refused, not guessed.
- Sources stay attached
Each number names the file it came from.
- Can run on your own machine
The language model can run locally, so research and positions stay inside.
- 01Ingest
Bloomberg files and supplied market reports, kept in their original form.
- 02Check
Ambiguous rows are excluded and missing values stay missing. Nothing is filled in silently.
- 03Analyse
Trend, risk, scenarios, relationships and a forecast check, on the cleaned history.
- 04Ask
Questions are answered from the stored data, with the source of every number.
- 9Bloomberg files in
- 15,800Rows read
- 30Rows excluded
- 4,225Observations kept
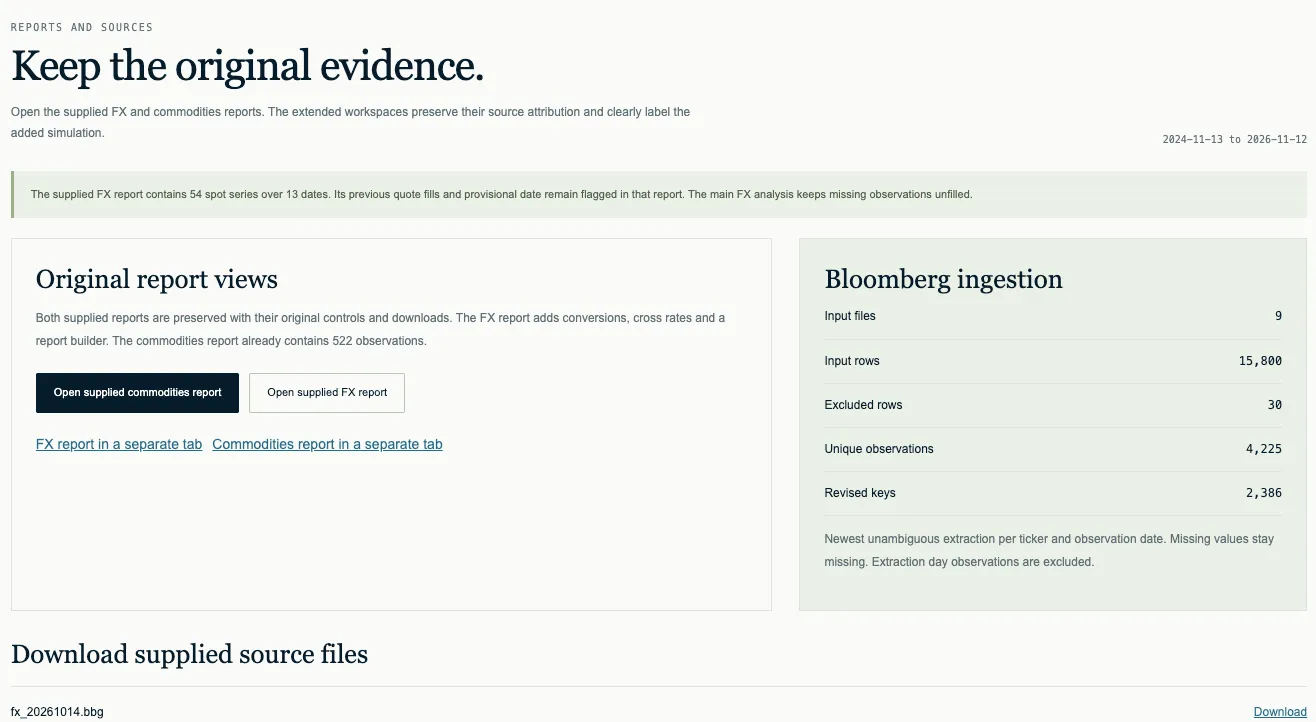
Sources
Bloomberg in, original evidence kept
- Bloomberg files ingested as they are, with every row counted
- The supplied FX report keeps its conversions, cross rates and report builder
- Simulated data, where used, is labelled and kept apart from source data